Reports
Sales, money in, expenses and profit for any date range and branch.
Reports shows whether the business is growing and where the money goes: sales, money in, expenses and profit, against the previous period.
For owners and admins. Admins see profit without payroll.
Steps to read the reports
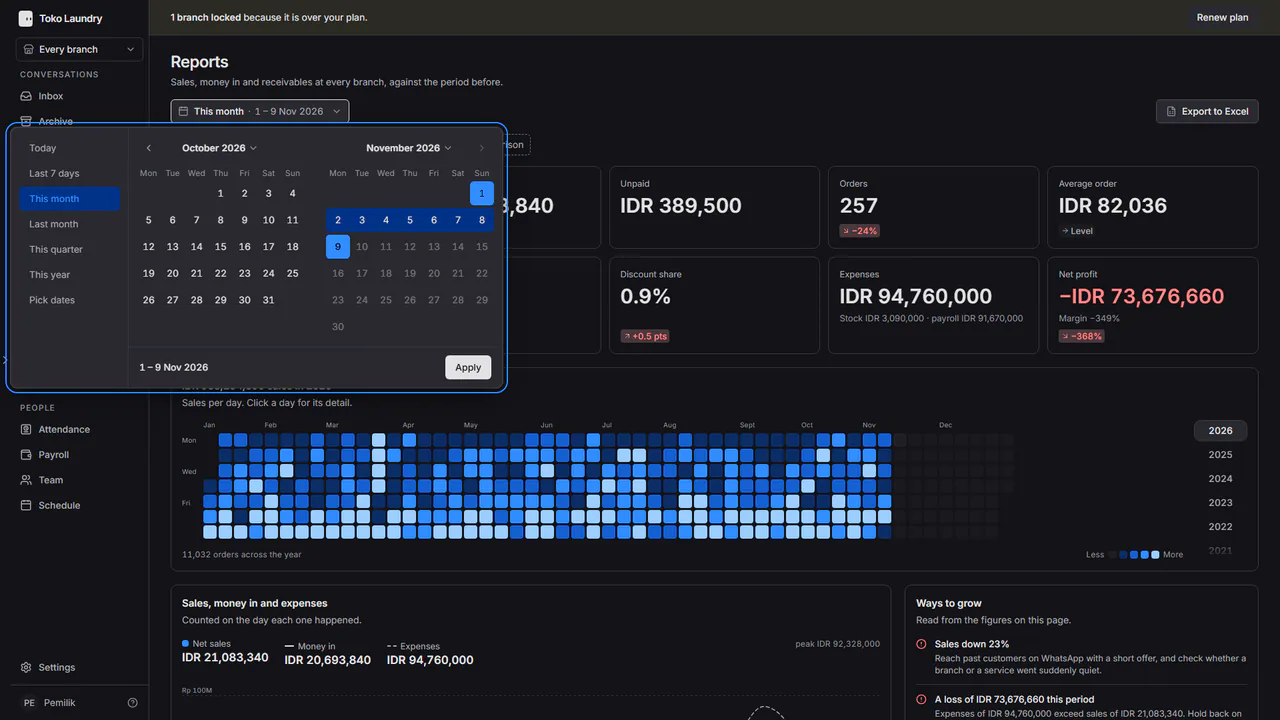
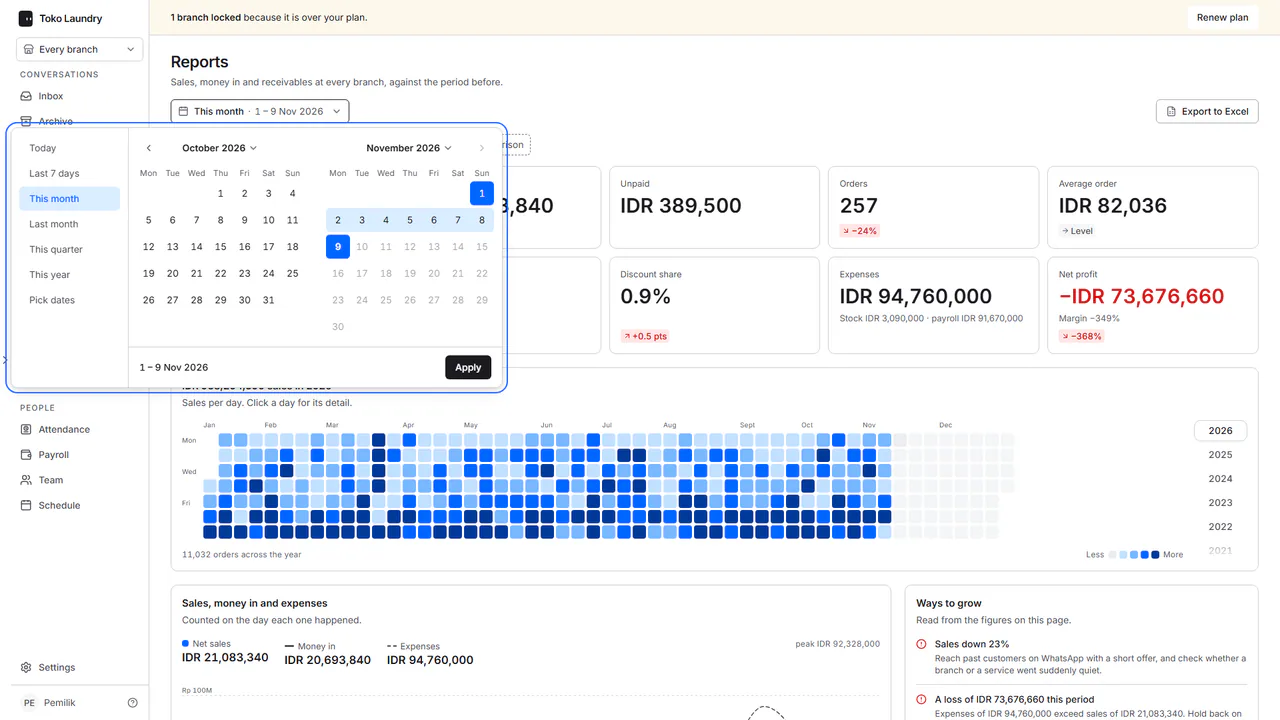
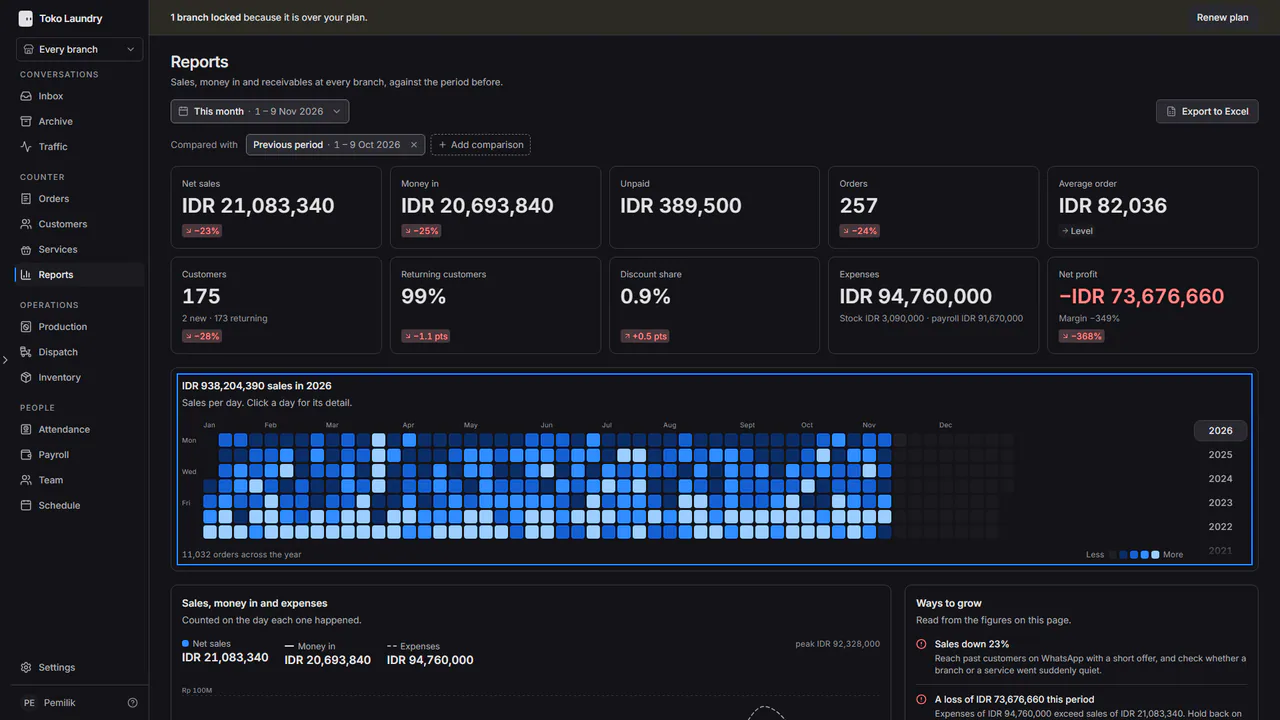
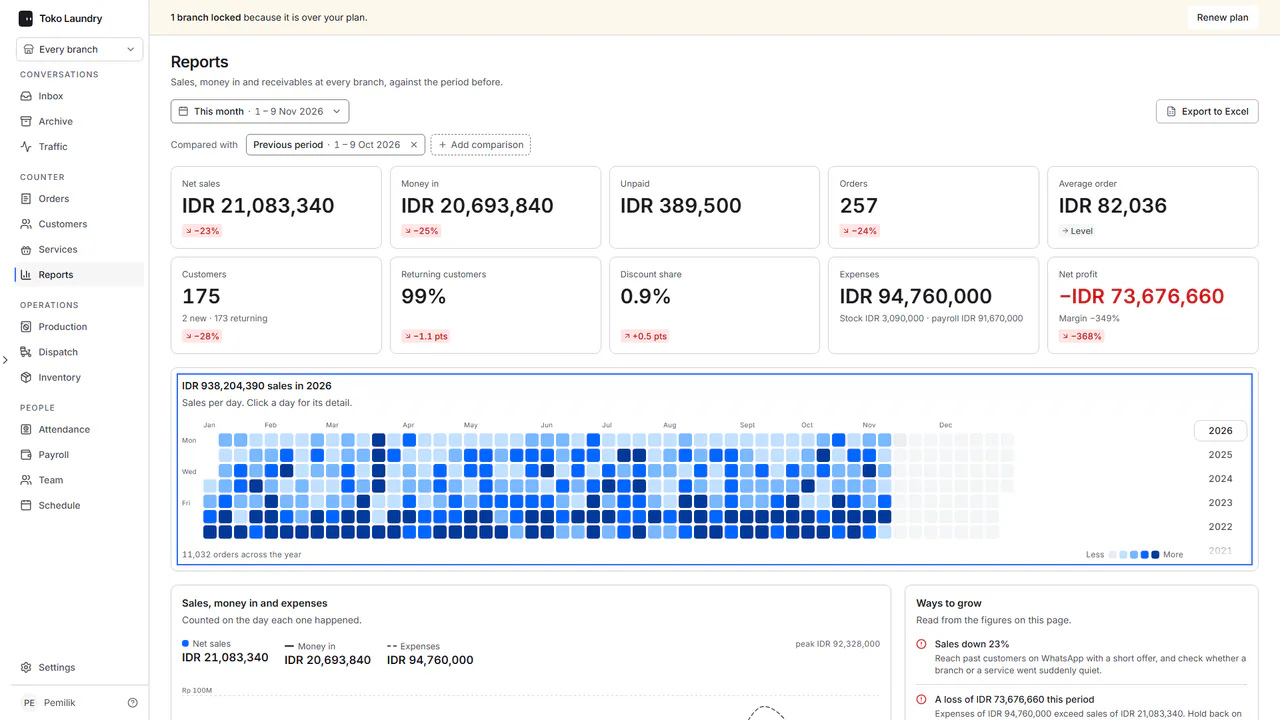
Press the range button at the top left, such as This month. Pick a quick range, or Pick dates and press Apply. A range is at most 366 days.
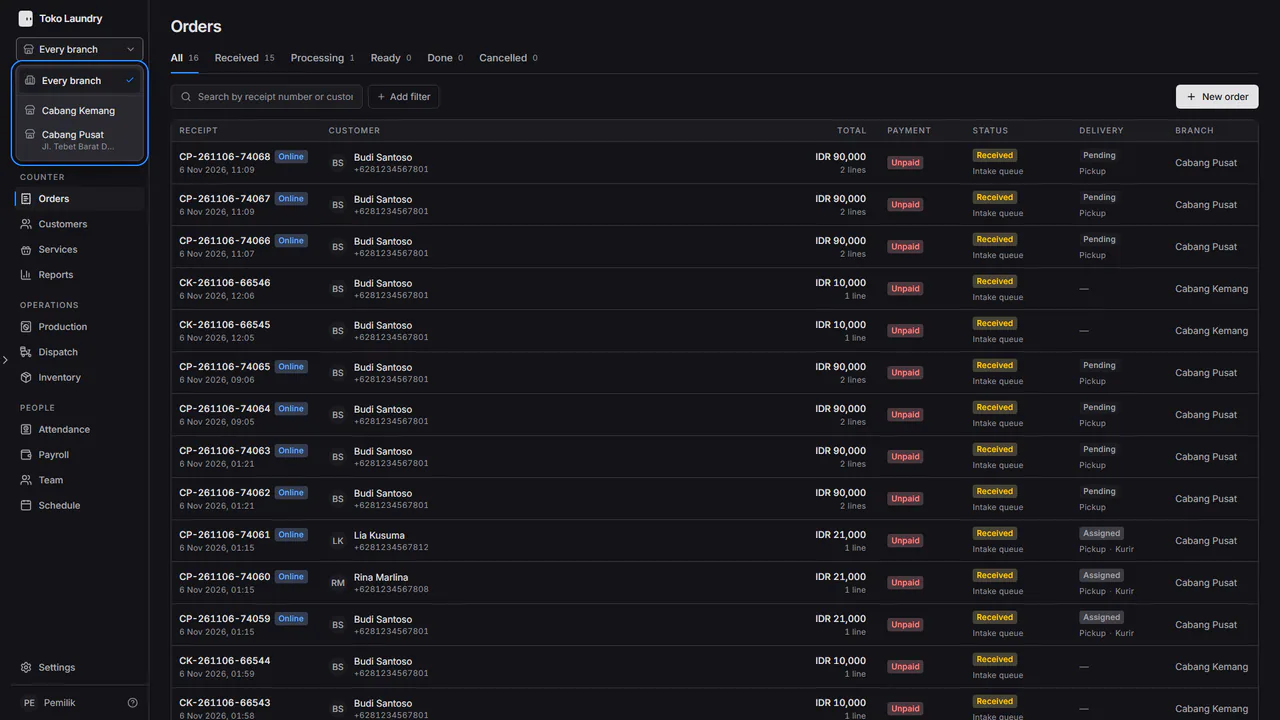
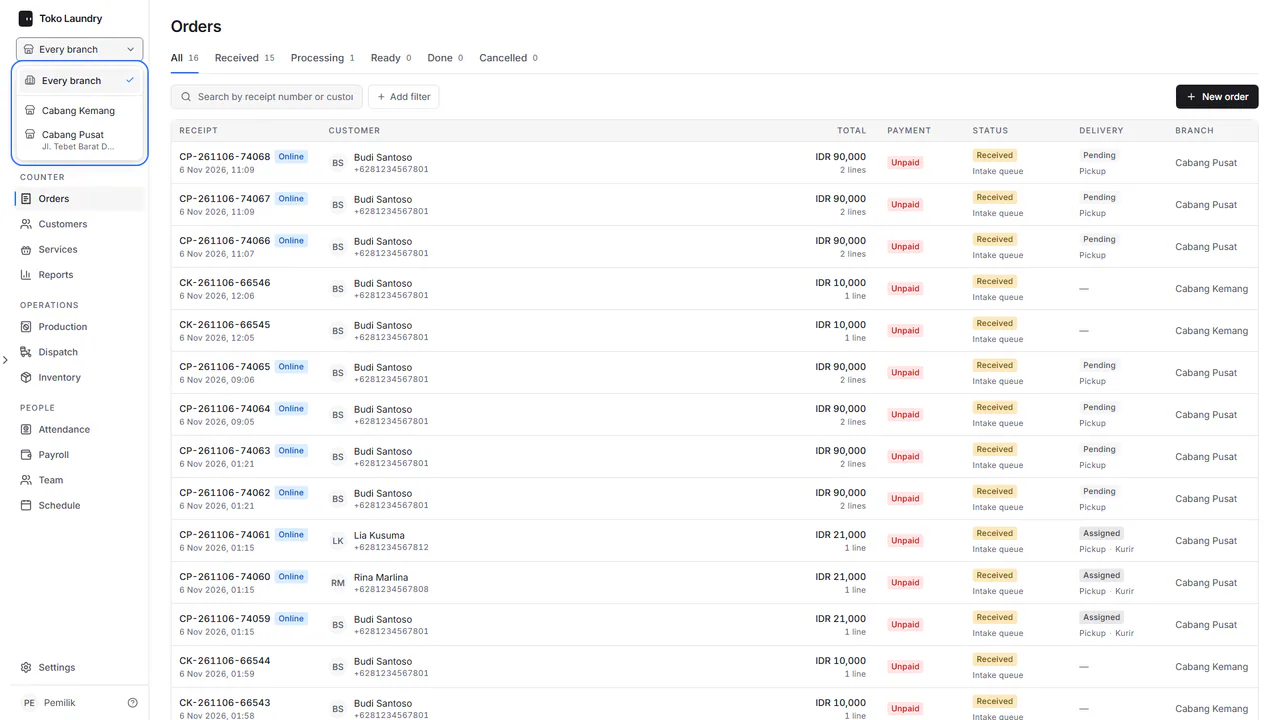
Pick the branch in the sidebar's branch picker, or Every branch.
Press Add comparison to add Last month, Last year, By quarter or your own dates, up to 4 comparisons.
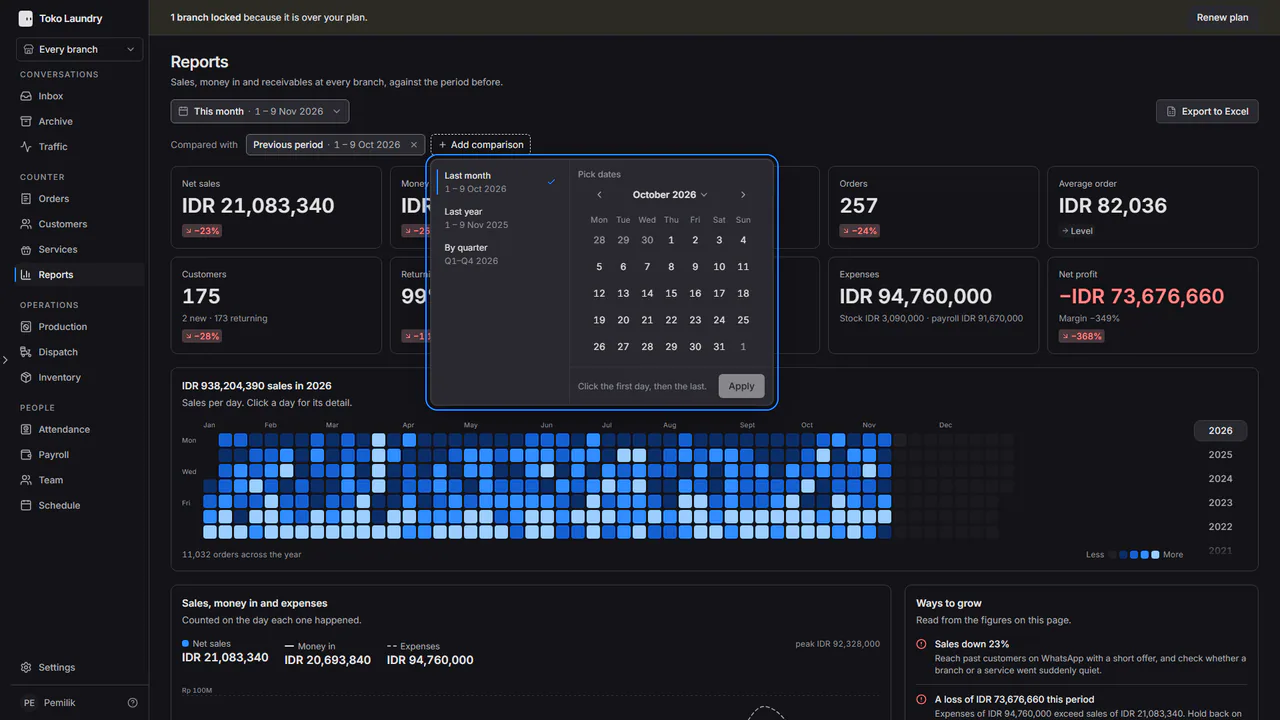
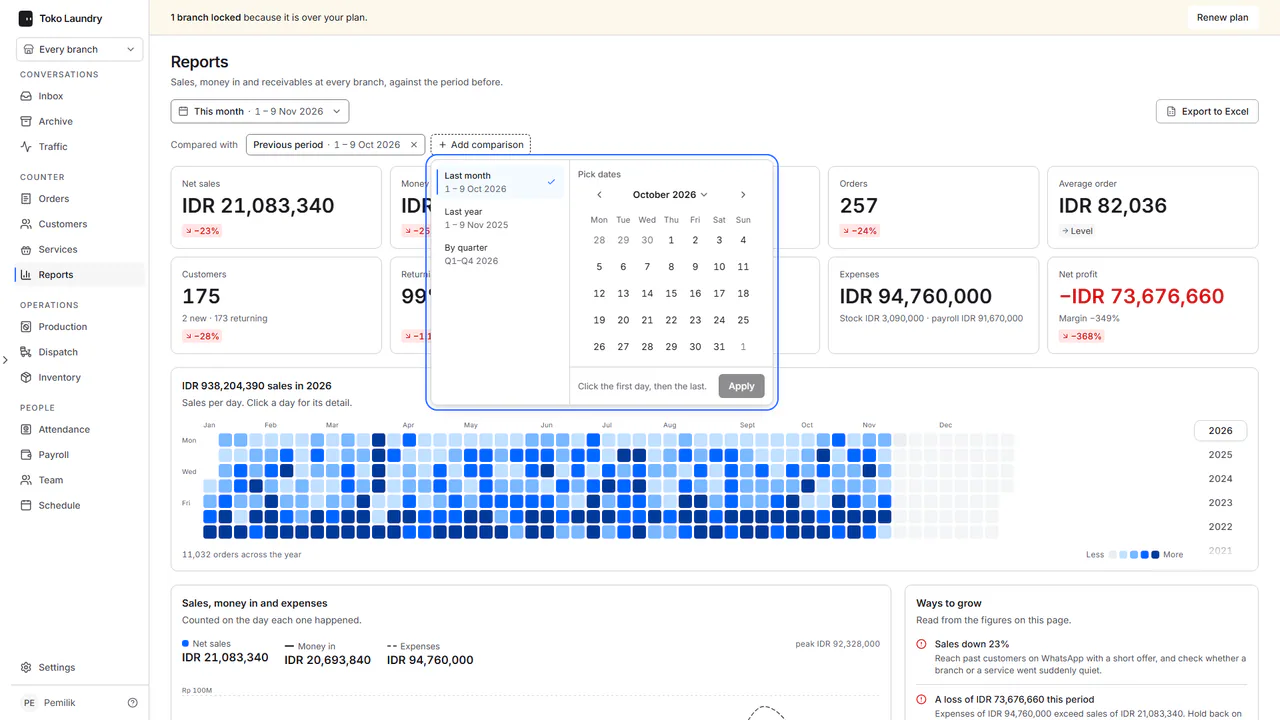
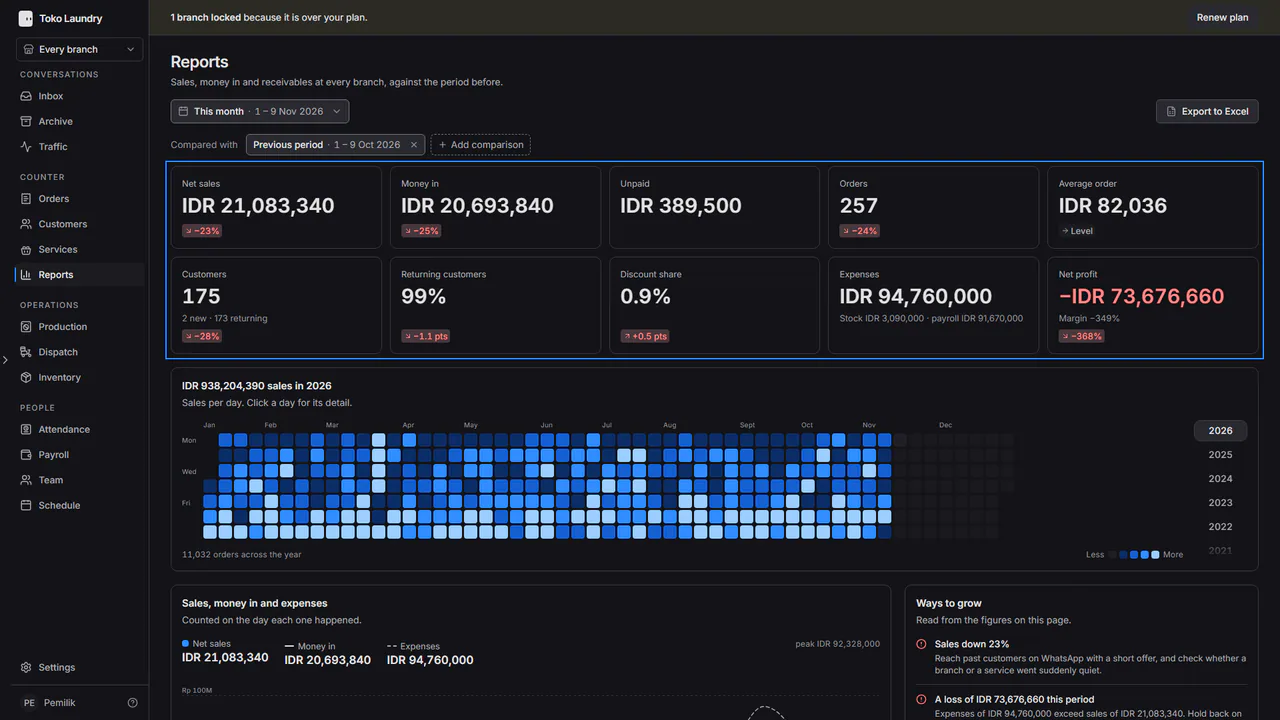
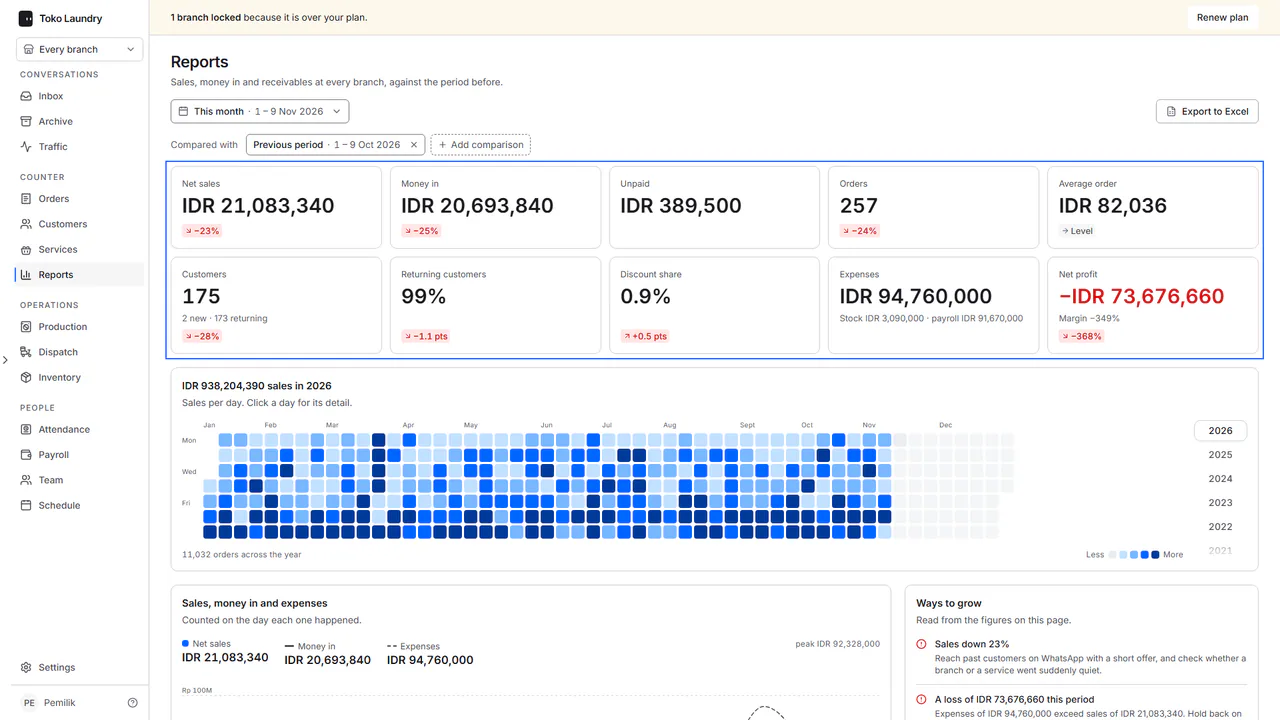
Read the headline figures: Net sales, Money in, Not yet paid, Orders, Expenses, Net profit and more, each with its change.
Below them, the sales calendar shows one square per day across the year: the darker, the busier. Pick the year on the right, and click a day for its detail.
Scroll to the daily chart of sales, money in and expenses, then branches side by side, services, payment methods, receivables by age, top customers and Ways to grow.
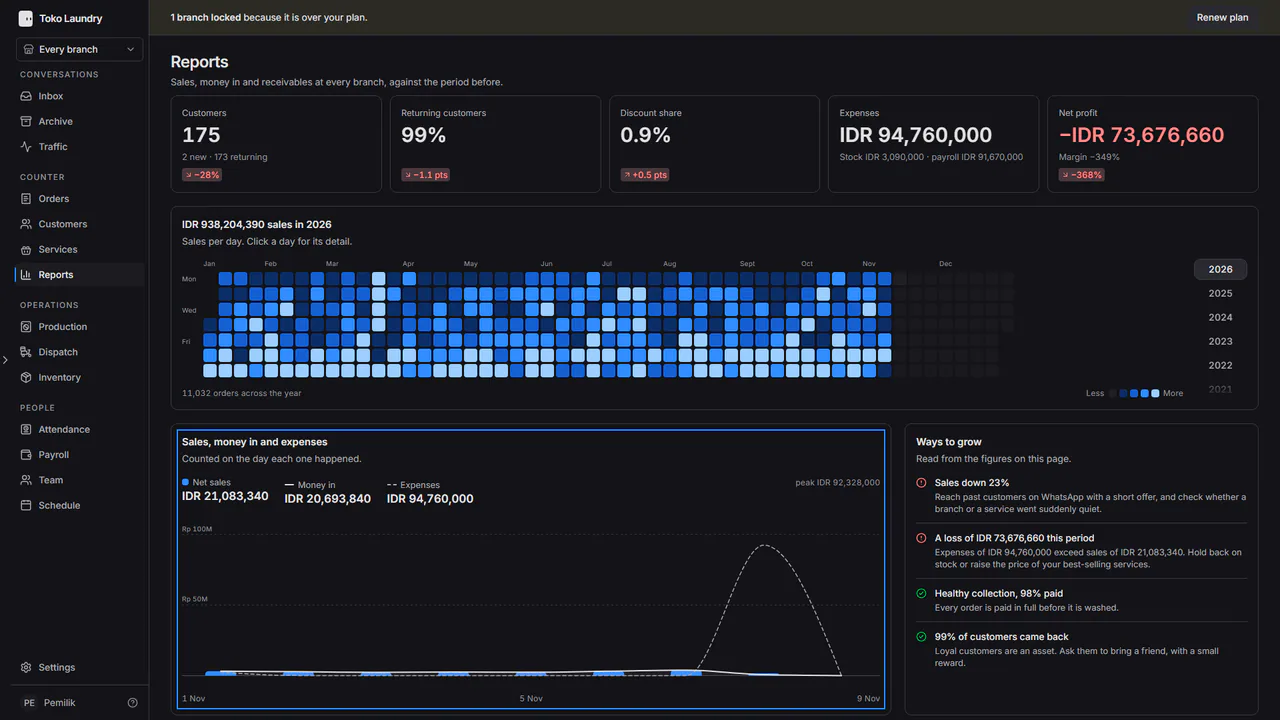
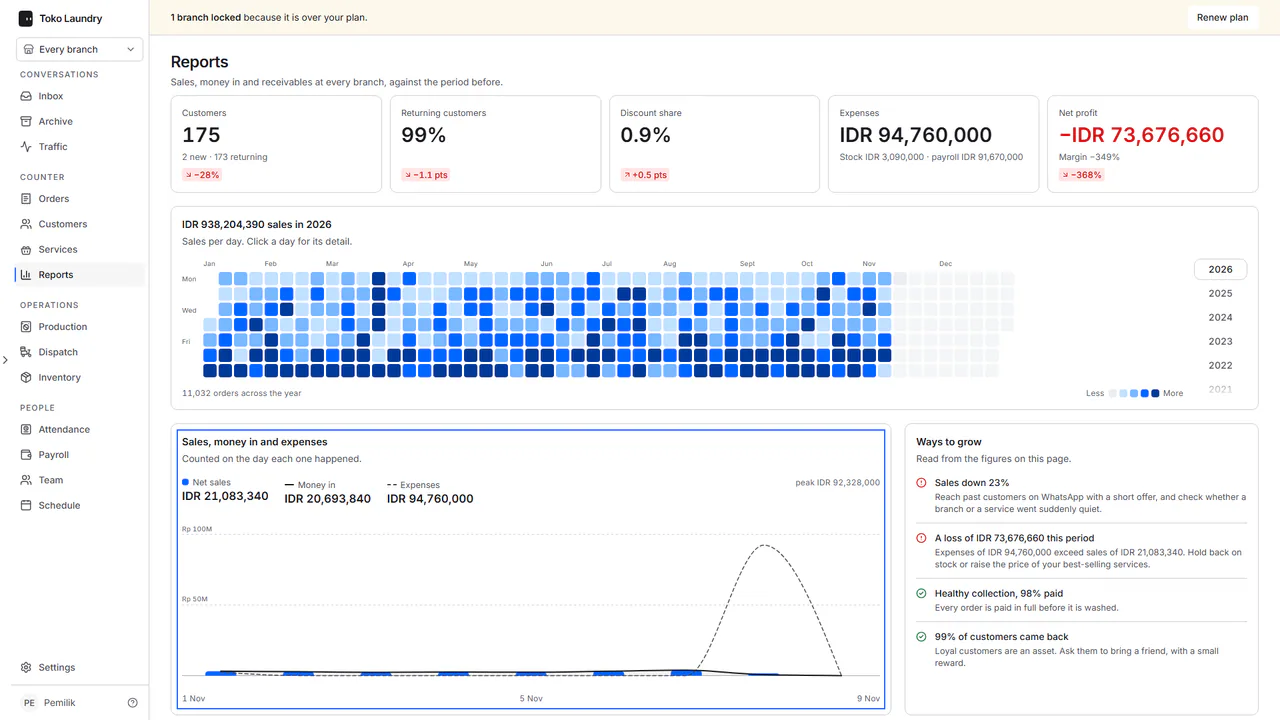
Expenses are stock purchases and payroll, so an admin's profit card reads Net profit (excluding payroll). Press Export to Excel to download the same figures as .xlsx.